Sport data always contains a lot of very interesting insights. We narrate a story about statistics in American Football. Having been inspired by Sheldon Cooper we decided to find out what helps professional sport players win. As good data scientists we are going to start discovering the data with nice visualizations. Looking at players positions, understanding coach strategies and team statistics give us some interesting ideas. So, grab a popcorn and enjoy the story! By the way, a lot of our graphs are interactive, do not forget about that during you reading and you will get even more insights!
American football is one of the most interesting and complex sports in the world. It is a sport game played by two teams of 11 players on a 120-yard rectangular field with goal lines on each end. The objective of the game is for one team to outscore the other. The offense, or the team with control of the ball, attempts to advance the ball down the field by running or passing the ball, while the opposing team aims to stop their advance and tries to take control of the ball. The offense must advance at least 10 yards in four downs, or plays, or else they turn over the football to the opposing team; if they succeed, they are given a new set of four downs. The place where the ball goes down becomes the line of scrimmage, and it is where the ball is placed for the start of the next play. Scoring can occur in the form of a touchdown (6 points), an extra point conversion (1 point), a two-point conversion (2 points), a field goal (3 points) or a safety (2 points).
For better and more detailed explanations of the rules we advise you to read this article and watch this video. If you are already into the game, you can find full games on this channel.
Being one of the most intricate sports in the world makes american football also one of the most interesting to explore. This sport game is made up of several key moments one of which is hand-off - the act of handing the ball directly from one player to another, i.e. without it leaving the first player's hands. To explore this interesting aspect of the game and, in general, the game itself, we used NFL dataset from kaggle competition "NFL Big Data Bowl". The dataset contains numerous statistics about the game (e.g. location) as well as players (e.g. position, speed, direction) all recorded at the time of hand-off.
The National Football League has the highest average attendance of any sporting league in the world with an impressive average attendance of 66,960 during the 2011 NFL season, by the way, it's almost half of Lausanne’s population. Best players are already assigned the same level of fame and respect as national heroes. Not only hero status but also an exciting life full of competitive spirit is what we recall when we think about football players. These make a number of children to dream about a career as a player of this fascinating game. To make this dream come true, they start training in high schools and colleges.
Let’s plot the number of games played in the state on the US map. Let’s also plot the popularity of each state for professional players studying. As you can see, there are huge differences in these maps. The most games are played in California, while most players studied in Texas. There are no games in the middle of the US, but some players studied there. From the previous plots, we learned that the distributions of games and players’ colleges differ significantly. It means that players often move to another state to join the professional team.
Let’s plot the most popular directions for a future career from each state (you can select an analyzed state). It’s interesting that some state has a very strong preference in such direction (for example, students from Texas prefer to play in California while students from Alabama usually moves to New York) but players who studied in other states (for example, in California) moves almost evenly to other states. We suppose that it is related to a difference in the work of scout teams in different states.
Looking at players' weight distribution depending on the positions they play, one can observe three 3 different groups. The first group ('heavy-weight' marked with red colour) includes player positions such as OT (offensive tackle) or G (guard) whose primary goal is both stop the run and put pressure on the quarterback. This explains why players in this group have median weight of more than 140kg. Wow!
In the group marked with blue colour ('light-weight'),there are positions like WR (wide receiver), which is again very natural, since such players must be agile to be able to catch the ball and run fast. The group in the middle ('medium-weight' marked with green colour) consists of mainly linebreakers, i.e. players whose primary role is to give instructions to other teammates and back up the line.
Sheldon Cooper is a young genius from the cult serial "Big Bang Theory". In one of the episodes about his youth Sheldon analyzes statistic of American Football games and proposes a tactic which then helps his father win a game.
– Statistically always punching on fourth down makes no sense. When the Aggies give up the ball on their own 5-yard line the opposing team has a 92% chance of scoring when they put deep from their own territory the other team still has a 77% chance of scoring but since they convert on fourth down 50% of the time the math says they should never punch again
Sheldon says that the probability to score when there are less then five yards left is 92%. In American Football there are 4 ways of scoring, but unfortunately from our data we can derive only the information about TouchDowns. Hovever it is the most popular and valuable way of score gaining, so that is also very interesting. So, let's check it out! For that we need to check if rusher crosses the end-zone. To do that we at first analyze how many yards from the line of scrimmage to the defence's end-zone at each down.
Very wierd outlier on the 75 yards? The answer is touchbacks - a ruling when the ball becomes dead on or behind a team's own goal being send by opposing team. Since 2018 NFL awards toucbacks by 25 yards kickoffs . But let's get back to touchdowns!
Knowing achived yards on a down we can draw a conclusion if there was a touchdown or not. On this plot you can see how likely a team scores with touchdown depending on a position of the line of scrimmage. We can see that the probability to score with a touchdown from 5-yard line is only 18.18%. But Sheldon doesn't lie, so may be he meant the probability to score having number of yards ≤ 5?
On this plot we have a probability to score starting from X yards or closer. One can do a touchdown from ≤ 5-yard line with a 40% chance. It is still much less than promised 92%. But, we still do not have an infromation about punches and throws, we can not conlude that Sheldon was right or wrong here. However this is a nice statistics, which may be useful for coaches.
Here we want to investigate how probable it is to gain next 4 downs by making 10 yards in 4 downs. For that we will compare number of made yards with the distance needed for achieving the goal.
If team does not move line of scrimmage 10 yards forward in 4 downs, ball obsession goes to a defending team. So, how likely team will achieve 10 yards and prevent trun-over? From the plot we see probability grows almost linearly and this is what we expect to see as the team moves gradually during the 4 downs. However there is slight decreas on the 4th down, what may mean that the deffensive team plays more aggressive on 4th down. So, the probability to convert on fourth down is 42% percent . That is very close to Sheldon's prediction, and as we also didn't consider the probability of the ball interception it may be even closer to 50%!
The probability to make a touchdown on the fourth down is almost 3 times higher than on the first one. While on average each down with sucsessfull handoff gives only 4 yards it should not affect the probability of touchdown on the huge distances. We explain this phenomenon by the fact that we plot P(Touchdown|4th down, rush) and a coach makes a decision to rush on a 4th down only when he is sure that the team will score. If you will see a game, usually team punch the ball on the 4th down, so the real probability
P(Touchdown| 4th down) is much smaller.
Strategy forms a major part of the game of American football, and both teams plan many aspects of their plays (offense) and response to plays (defense), such as what formations they take, who they put on the field, and the roles and instructions each player are given. Throughout a game, each team adapts to the other's apparent strengths and weaknesses, trying various approaches to outmaneuver or overpower their opponent to score more points in order to win the game.
Since our data is about hand-offs, let’s take a look at formations which are usually used in such games.
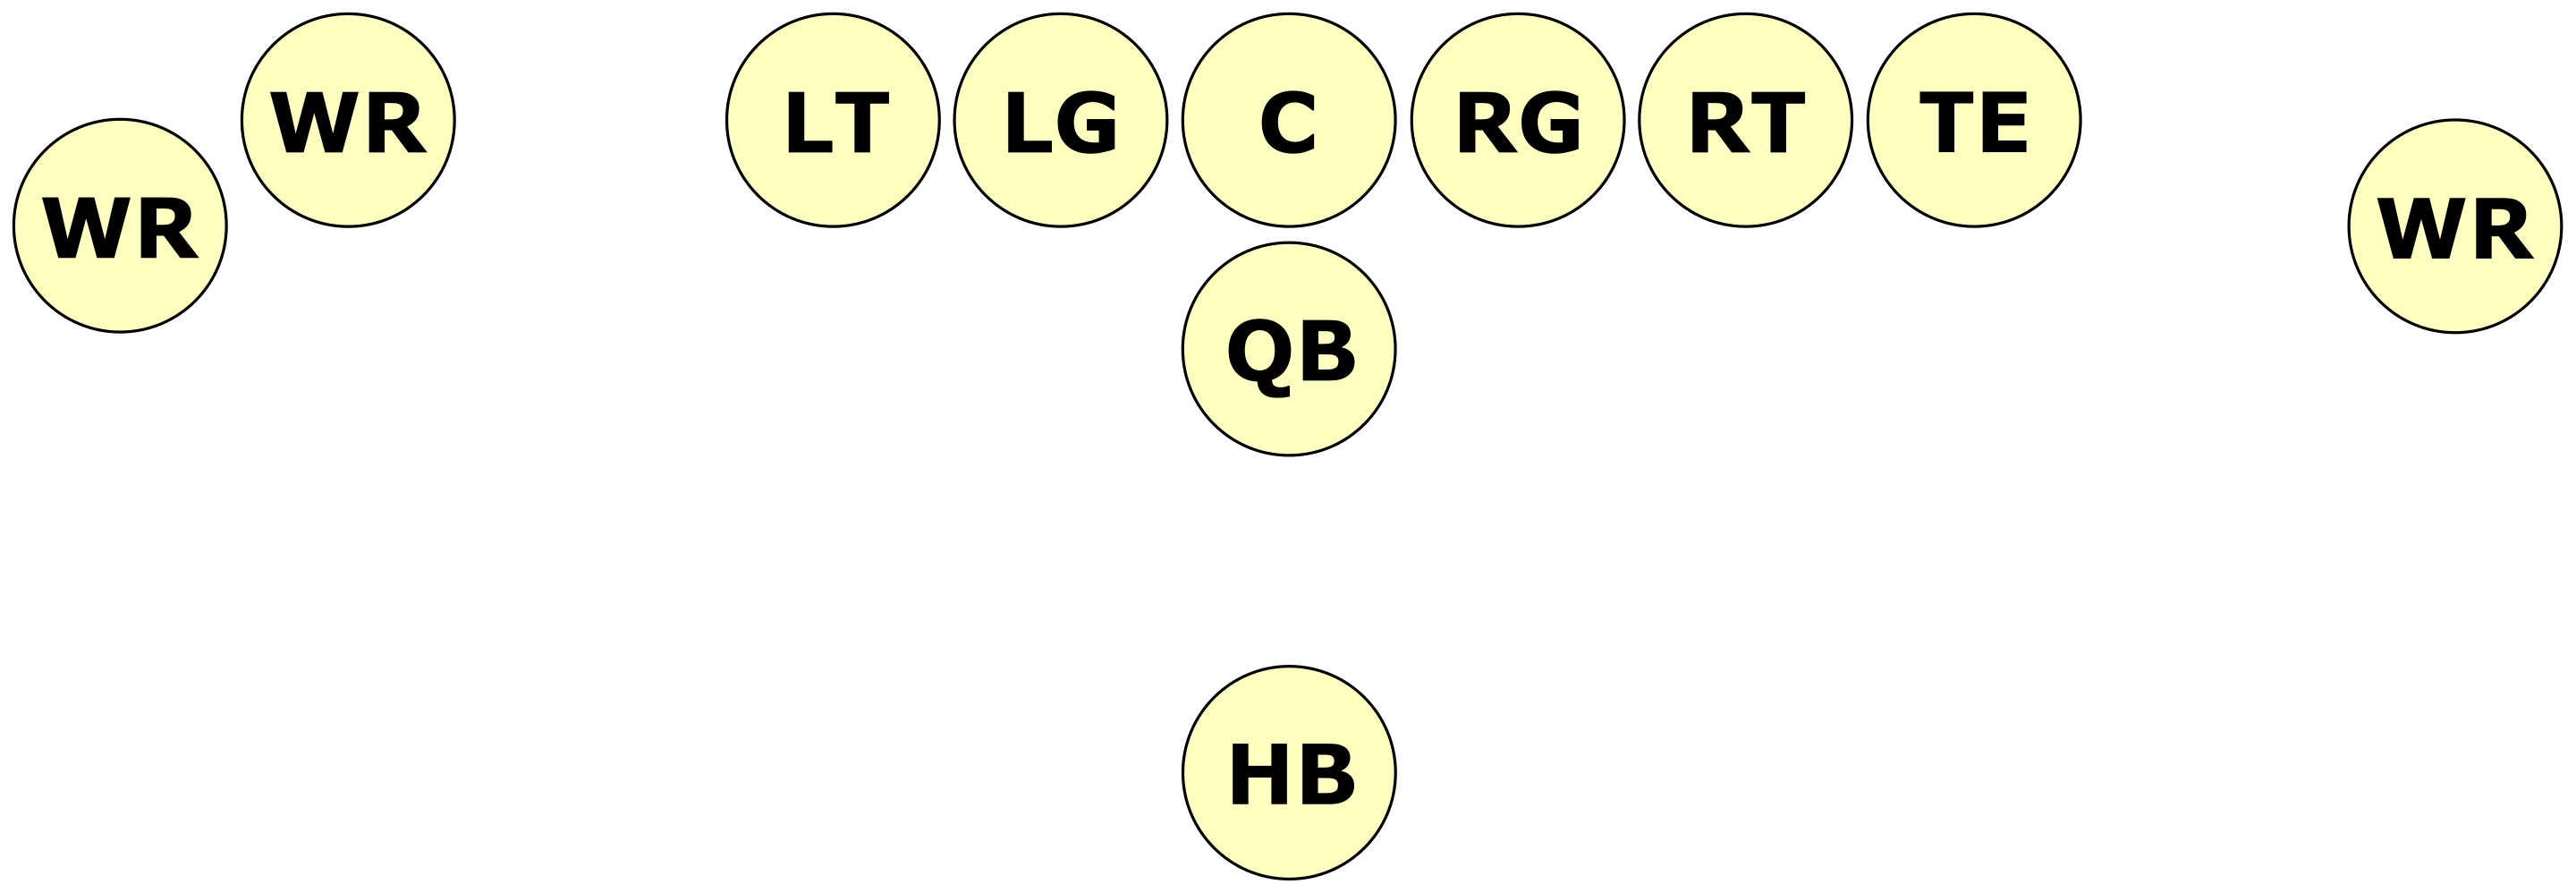
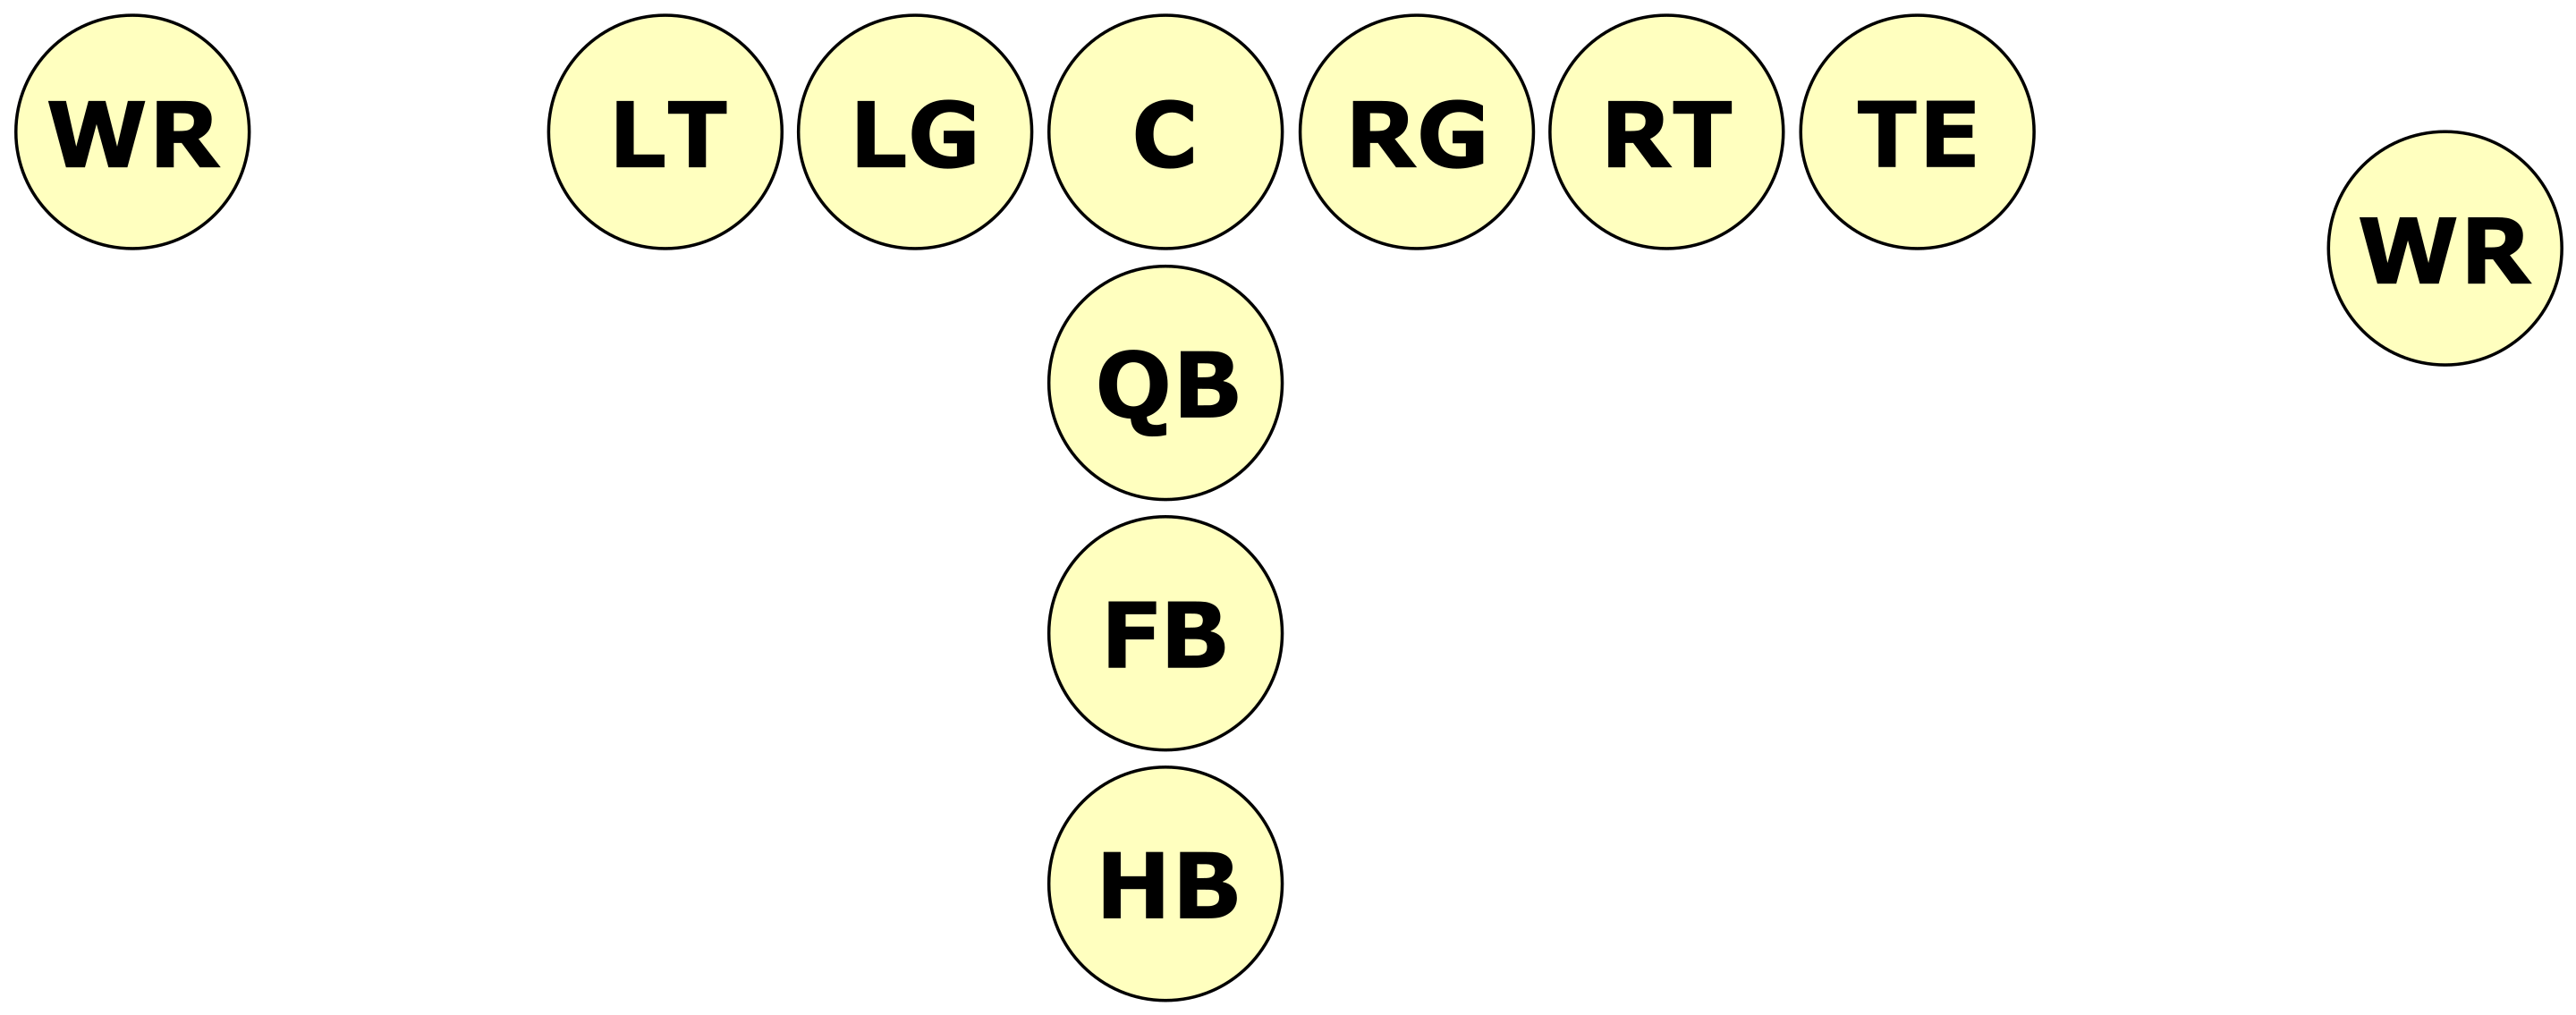
We can separate the three most popular formations which are used in almost 95% of the games : SINGLEBACK, SHOTGUN and I_FORM. Their corresponding schemes are shown below.
In american football, we can point out two areas of field as special ones. These are the areas close to team’s end zones and have a width of 20 yards. High probability of touch down in these zones makes coaches to change their tactic. Therefore, it makes sense to compute what tactics were mostly used per zone of field. For that we will divide field on five 20-yards long zones and for each calculate number of times when each formation was used. The plot shown below illustrates computed statistics in terms of distance from offensive team’s endzone.
What we observe is that hand-off technique is usually used in the zone of 20-40 yards from own end zone. With increase of distance from that zone, the number of times when hand-off was used gradually decreases. Another interesting aspect is that coaches not only prefer SINGLEBACK formation in general but they do it for for each zone. But, is SINGLEBACK the best offensive formation for all cases? To investigate that, let’s compute average number of yards gained for each formation.
Plot reveals dramatic drop of efficiency when offence team is close to the opponent's end zone. Statistically, hand-off allow to gain the highest number of yards in the 20-40 yards zone , which coincides with coaches’ approach. But the thing which coaches might do wrong is favouring SINGLEBACK formation over SHOTGUN since the former has significantly lower value of average yards gained for each zone. Things get even more interesting when we consider the closest to opponent's end zone area. In this case, the best tactic to use is I_FORM.
The main insights we studied: